A Halfway Look at Housing with Graphs and Charts - Mortgage Rates are Not Helping Homebuyers

Halfway through the year and it is a good time to consider the housing market and see what is going on. From an investment standpoint, we are following the non-agency residential CMO market for reasons explained below.
First things first, let's look at mortgage rates:

What is curious is that we are seeing about a 20bps spread from where we are this year compared to last year. That spread with the 10-year treasury yield is about 200bps.

Furthermore, between 4/24/2021 and 4/7/2022 there was not a single weekly average 30-year fixed mortgage rate reading above 5.00% according to Freddie Mac's data. The 30Y mortgage crossed the 5% threshold on April 14th, 2022. It had not crossed that 5% line since February 2011. 11 years!

That being said, it appears that Americans just waiting to move and sitting on their 3% mortgage is starting to slow down. Active US housing inventory is starting to perk up:

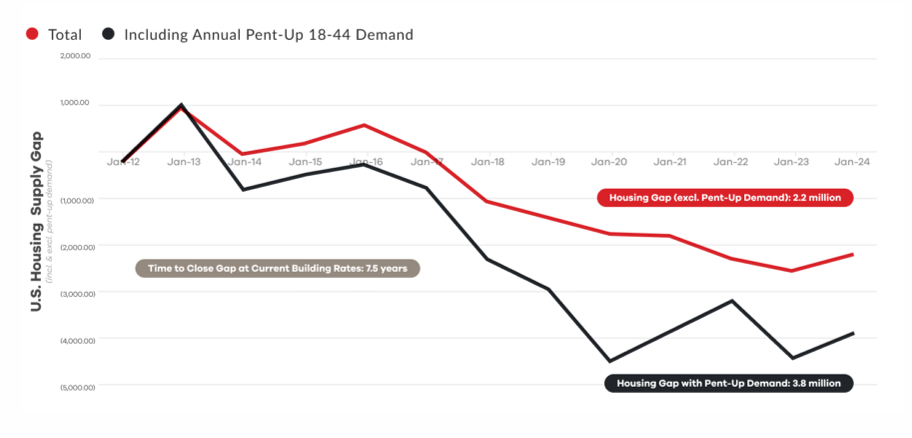
But even with an increase in inventory, the housing supply gap remains. So, the question is: who will win? Sellers holding onto low-rate mortgages or buyers waiting out high mortgage rates?
The percent of US homes for sale 0.7% of total US housing, nearing the lowest in nearly 5 decades.

Existing homeowners are still strong on their mortgage payments but consumer credit in general is showing signs of trouble. Mortgage delinquencies remain near 20-year lows while other credit sector hint at trouble. Especially with credit card delinquencies and student loan payments.

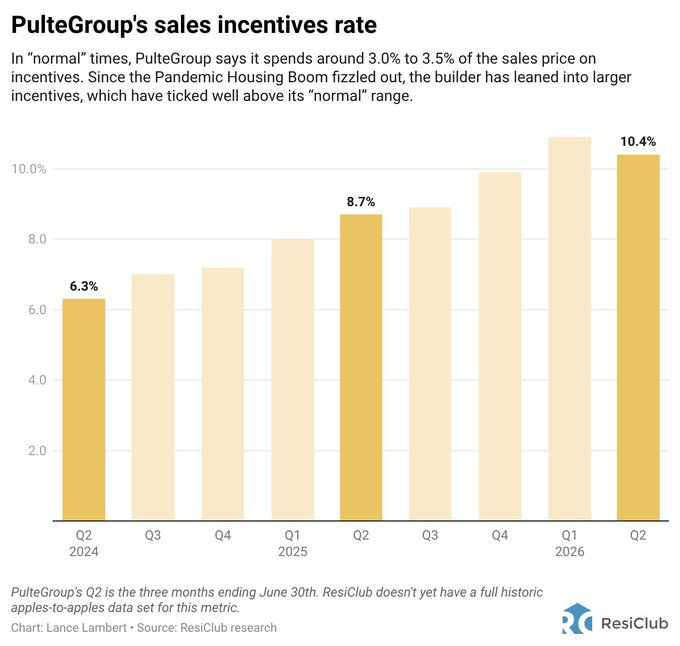
We won't do a deep dive into the homebuilder economy here today. However, homebuilder incentive rates are worth investigating. Typically, sales incentives are somewhere between 4-6% of sale price. In Q2 2026, PulteHomes rates rose to 10.4%.
The 15 largest publicly traded homebuilders saw gross margin compression between Q1 2025 and Q1 2026.

From an investment standpoint, we really like the non-agency residential CMO market. The underlying value characteristics are a result of the market crisis, market technicals, and the resilient housing market of the last 15+ years.

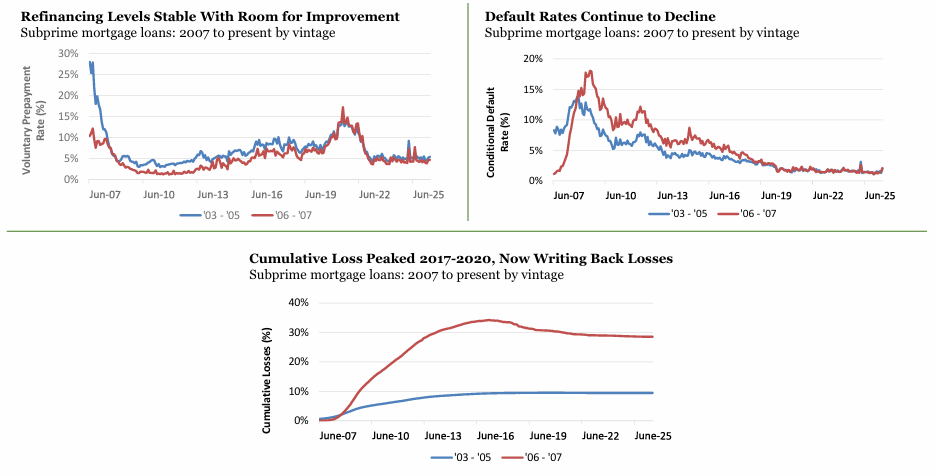
The seasoning is an important characteristic. The surviving subprime borrowers of 2003-2005 and 2006-2007 are much different than subprime borrowers today. Stable prepayment speeds, declining default rates, and loss writebacks are all characteristics of the subprime market.
And you can really see and understand this aspect through mortgage amortization. Homeowner equity can increase from either rising home prices or decreasing mortgage loan balances.

You can see de-leveraging around 7% each year as a result.

The housing market is in a bit of flux and it looks as if "higher" rates will be the norm for the foreseeable future. Putting the 30-year mortgage rate back to historic norms. As an investor, there might be some interesting pockets to take advantage of as a result of the 2008 GFC.
Comments