Are There Any Lessons To Be Learned From the VIX Chart? Is the VIX High or Low?
- Jonathan Poyer
- May 11, 2023
- 2 min read

The VIX is a very complicated instrument not meant to be played with lightly for investors. At the same time, it can communicate useful information to investors about markets. The VIX was started after the "Black Monday" crash in 1987 and rolled into an index in 1993 by the Chicago Board Options Exchange (CBOE). Basically, it uses stock-market bets, known as options, to gauge expectations for the speed and severity of market moves: aka volatility. VIX futures were launched in 2004 by Goldman Sachs to serve a need for Mark Cuban (crazy story) and VIX options followed in 2006.

VIX is a measurement of options prices over the next 30 days and tries to reflect what is happening across many different option strike prices. Again, trying to gauge volatility and share insights about the markets.
So, let's take a look at the VIX over the past 10 years:

VIX spends around half its time under 19. The past few years stubbornly hanging in the 20s and 30s may have been more of the outlier.
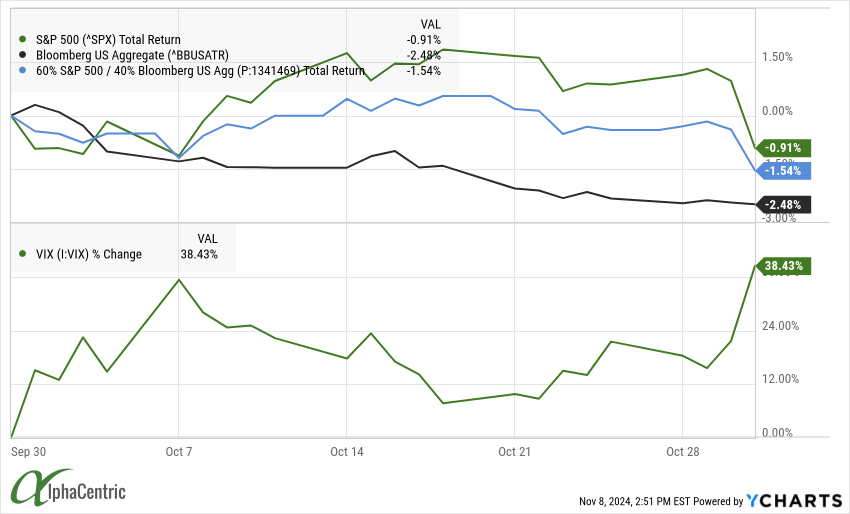
You may see percentage gains quoted from time to time for the VIX, but that isn’t a great way to look at the VIX, which is itself a percentage number quoting the expected annualized volatility for the S&P 500. We view a “spike” in the VIX as at least 10 points (so from 24 to 34, or 13 to 23, etc), where the so called banking crisis only took the VIX from 20.5 at the start of the month to 26.5.
The 2022 market selloff occurred with the VIX starting around 20, then averaging just 23 for the period before finishing below where it started, falling to 18.70. In comparison, March 2020 saw the VIX move from around 15 up to 75.

Volatility seemed to have a stubborn floor throughout the period, averaging 23 instead of falling back into the teens as was the pattern for much of the 2010 to 2020 period.

Looking ahead, the market appears at an important turning point with many uncertainties remaining around risks such as recession, interest rates, inflation, and geopolitical issues. Will the economy enter a downturn, or will growth continue at a steady pace?
The Federal Reserve may have raised rates for the last time this cycle. But how long will they stay there, and how will that impact risk assets, valuations, and economic growth?
For the first time since the COVID-19 pandemic first hit, it really feels like there are reasonable arguments on both the bull and bear sides. The future could unfold as a tale of either steady growth and healthy markets or deceleration, tightening monetary policy, and falling asset prices.


Comments